


Via Ponte dei Granatieri, 8
36010 Chiuppano (Vicenza), Italy
R.E.A di VI: 210567
R.I di VI: 08808900156
Cap. Soc: € 5.200.000,00 i.v

The OMERA state-of-the-art strain measurement systems are able to detect and display the strain curves per each work cycle. To do this, the standard configuration includes strain sensors (generally two, but even more), a multichannel signal amplifier and a dedicated data acquisition unit. Additional information such as strains and vibrations inside the dies can be collected and displayed giving additional elements like i.e. loads on a multi-station die or scraps evacuation check, for an improved process control. If this information is not strictly necessary and only the monitoring of the process and its stability is required, a different and simple solution can be considered. The present analysis concerns a simplified configuration suitable to detect and display the maximum strain value, acting on the press structure and as consequence on the die during each machine work cycle. This solution was implemented on several mechanical presses with both eccentric and soft blanking configurations, adopting a two-channel amplifier with two piezoelectric strain meters. The results were compared with the corresponding pressure curves recorded with an Hydac HMG-4000 measurement system. Figure 1 shows several working strength profiles of a multi-station die installed on a 2-rod composite mechanical press 630 tons with a slow-motion linkage (Link-Drive).
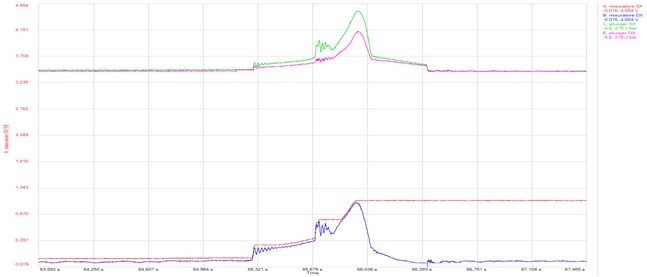
The pink and green curves are detected by the hydraulic pressure transducer and show the two pressures of the hydraulic safety valves located on the RH and LH press thrust plunger units. The blue curve indicates the real-time signal recorded by the RH sensor unit. The red curve shows how the Peak function recording works starting from the corresponding sensor measurement. Comparing the two LH channel signals (the green curve with the blue one) we can notice that the same behaviour is displayed. The three steps shown on the red profile give us some information about the process. In this case, we have a multistep die where different operations are performed at different stroke heights. The 1st step represents the nitrogen springs contrast and a small drawing operation, the 2nd one some blanking operations (represented by the peaks), and the 3rd one the stamping and coining operations. Figure 2 shows a coining operation with asymmetric load.
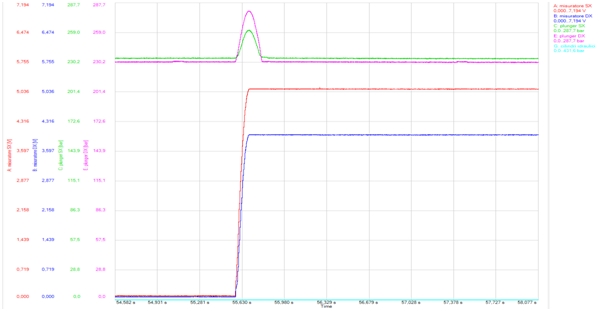
As before, the pink and green curves display the hydraulic pressures located on the RH and LH press thrust plunger units. The red and blue curves are now showing the strain recorded by the sensors with “Peak Function” display ON. As before, comparing the pink curve with the red one and the green curve with the blue one, the same behaviour can be noticed. Figure 3 shows how an increase of the press load hydraulically detected on the RH and LH press thrust plunger units (pink and green curves) is displayed by the strain peak measurement system (RH and LH channels, blue and red curves).
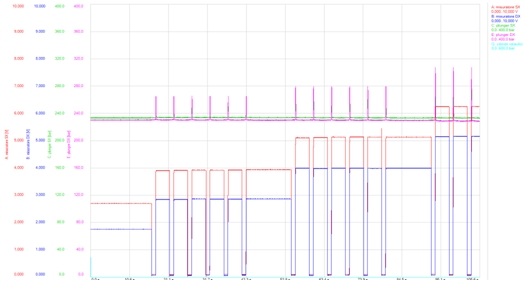
Finally, we can appreciate in Figure 4 the stability of the signals recording in case of a stationary process long-lasting test.
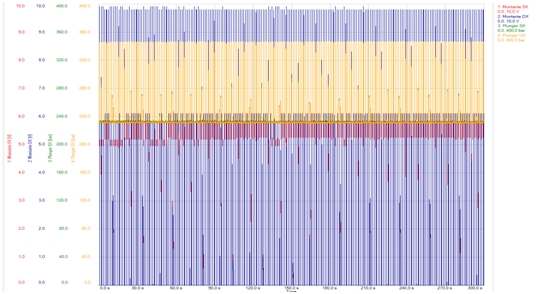
To conclude, the proposed simplified Strain Peaks Measurement System can be enough for process trend analysis aimed to display critical issues or drifts such as dies wearing, dies overheating or not adequate lubrication. If more specific or detailed process information is needed, the all-inclusive configuration with a dedicated data acquisition unit and additional die strain and vibration sensors is anyway available. Omera R&D department
